Feature: Endpoint Status in Admin
When to use
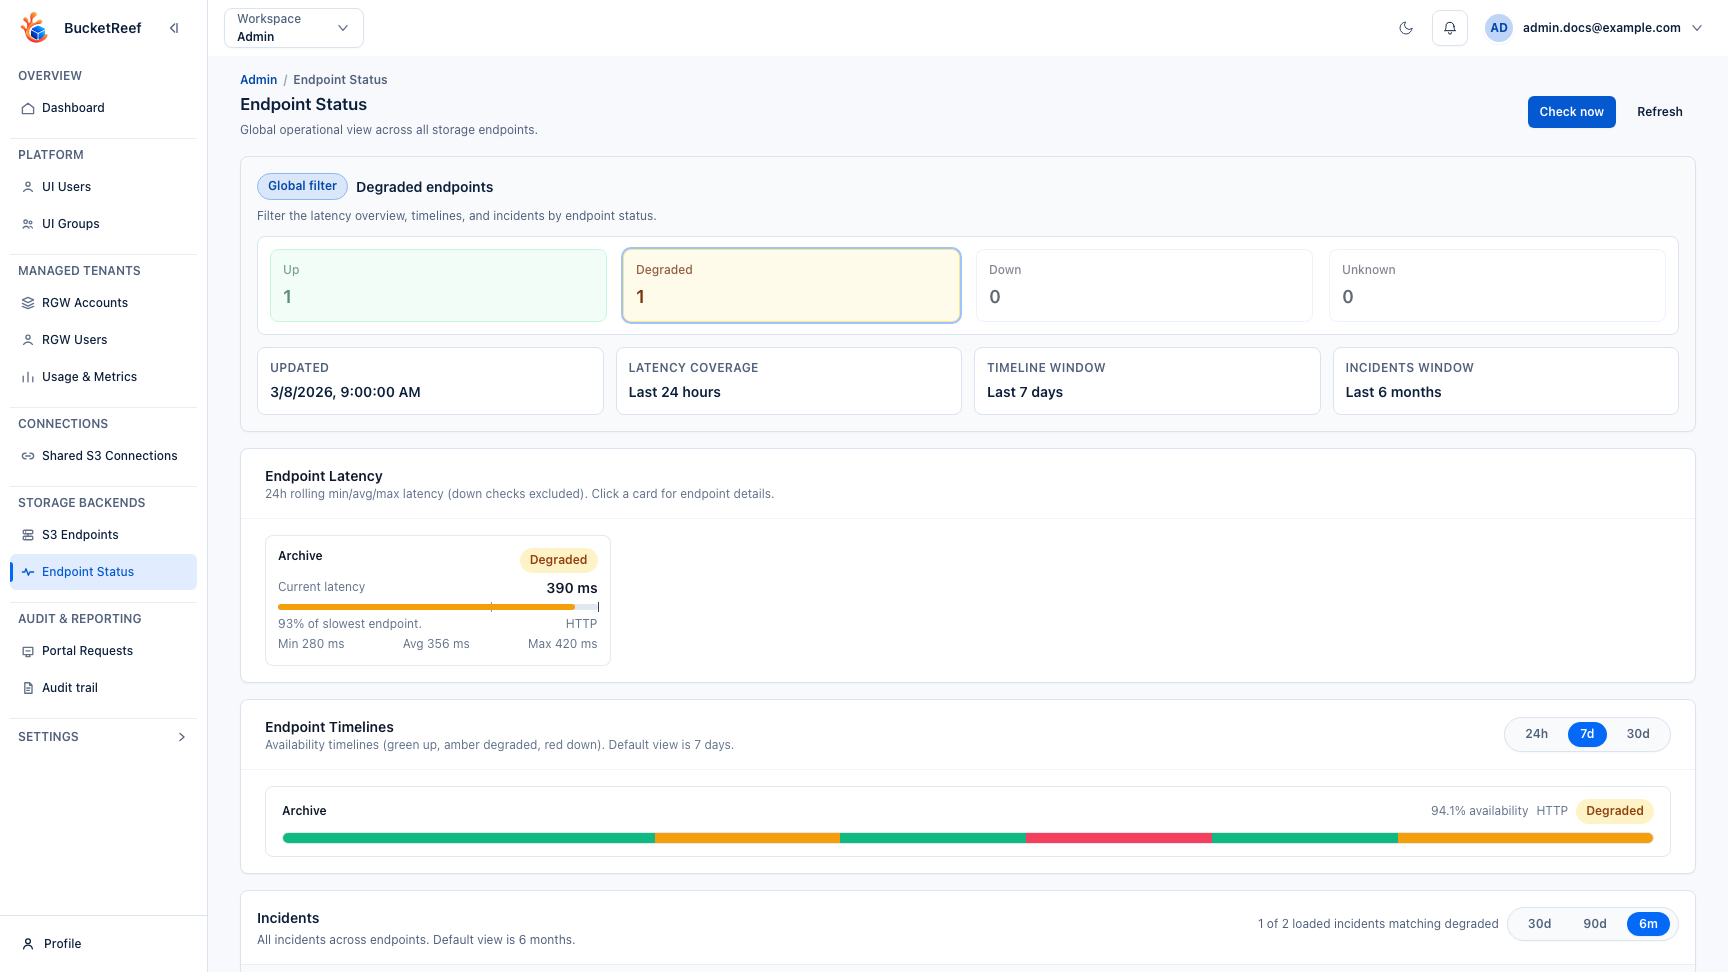
Use this page when you need a global healthcheck view across the storage endpoints managed by the platform.
Prerequisites
ui_adminorui_superadminrole.endpoint_status_enabled=truein general settings.
Before you start
Use Endpoint Status as a triage page. It tells you which endpoint needs attention, then Ops pages and backend logs explain why.
Steps
- Open
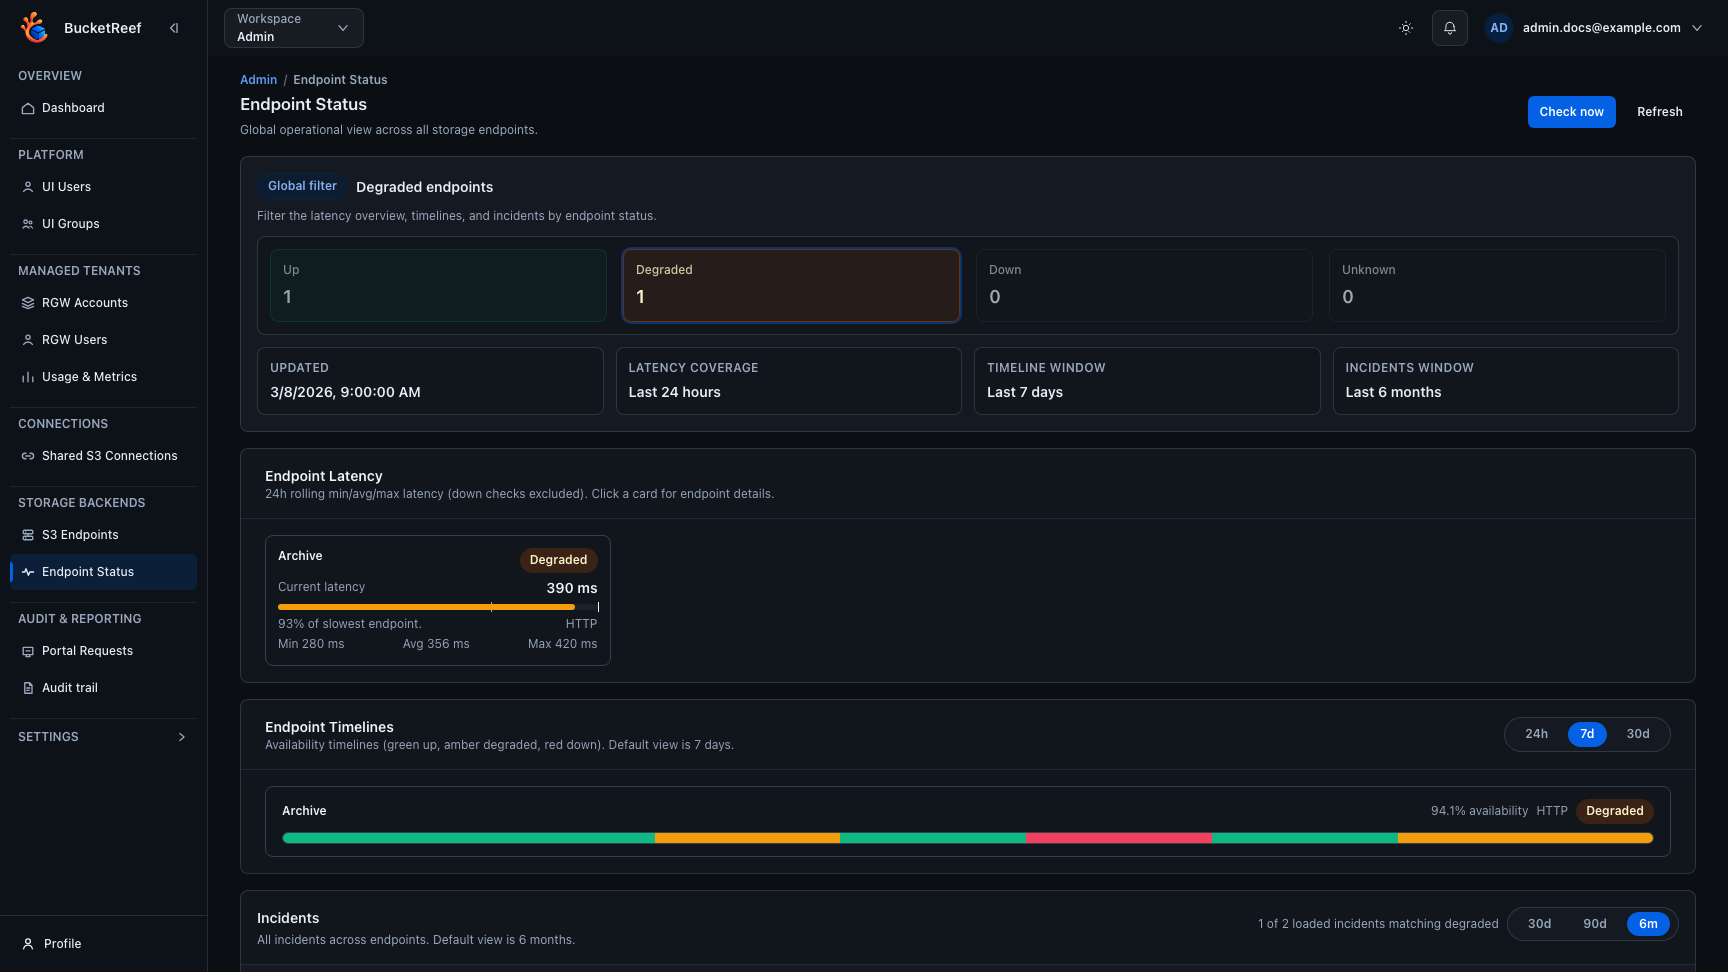
/admin/endpoint-status. - Use the global status cards to focus on
Up,Degraded,Down, orUnknownendpoints. - Review the latency overview to compare current, minimum, average, and maximum response times.
- Use timelines and the incidents table to understand stability over time.
- Use
Check nowwhen you need an immediate healthcheck refresh before investigating further.
Note
In the latency overview, an orange current-latency bar means the current sample is significantly above the 24h average. It is a comparison signal, not an incident by itself; use the status pill and timeline for health state.
Expected result
You can assess current backend health quickly and identify which endpoints require follow-up.
You are done when
You can name the affected endpoint, current status, latest latency signal, and whether the issue is current or historical.
If you do not see this action
Check endpoint_status_enabled, Admin access, and whether endpoints are configured for healthchecks.
Limits / feature flags
Note
This page is available only when the Endpoint Status feature is enabled in app settings.
Related pages
Visual example